

2·
1 year ago#LabPlot isn’t exactly an open-source #MATLAB, but it is a an open-source and cross-platform tool for visualizing and analyzing data.
It focuses on creating interactive scientific plots and offers features like curve fitting, Fourier and Hilbert transforms, data manipulation, and live data support.
Computing with e.g. #Python, #R, #Maxima is also possible with interactive notebooks available in LabPlot.
You can see a list of LabPlot features here:
➡️ https://labplot.org/features



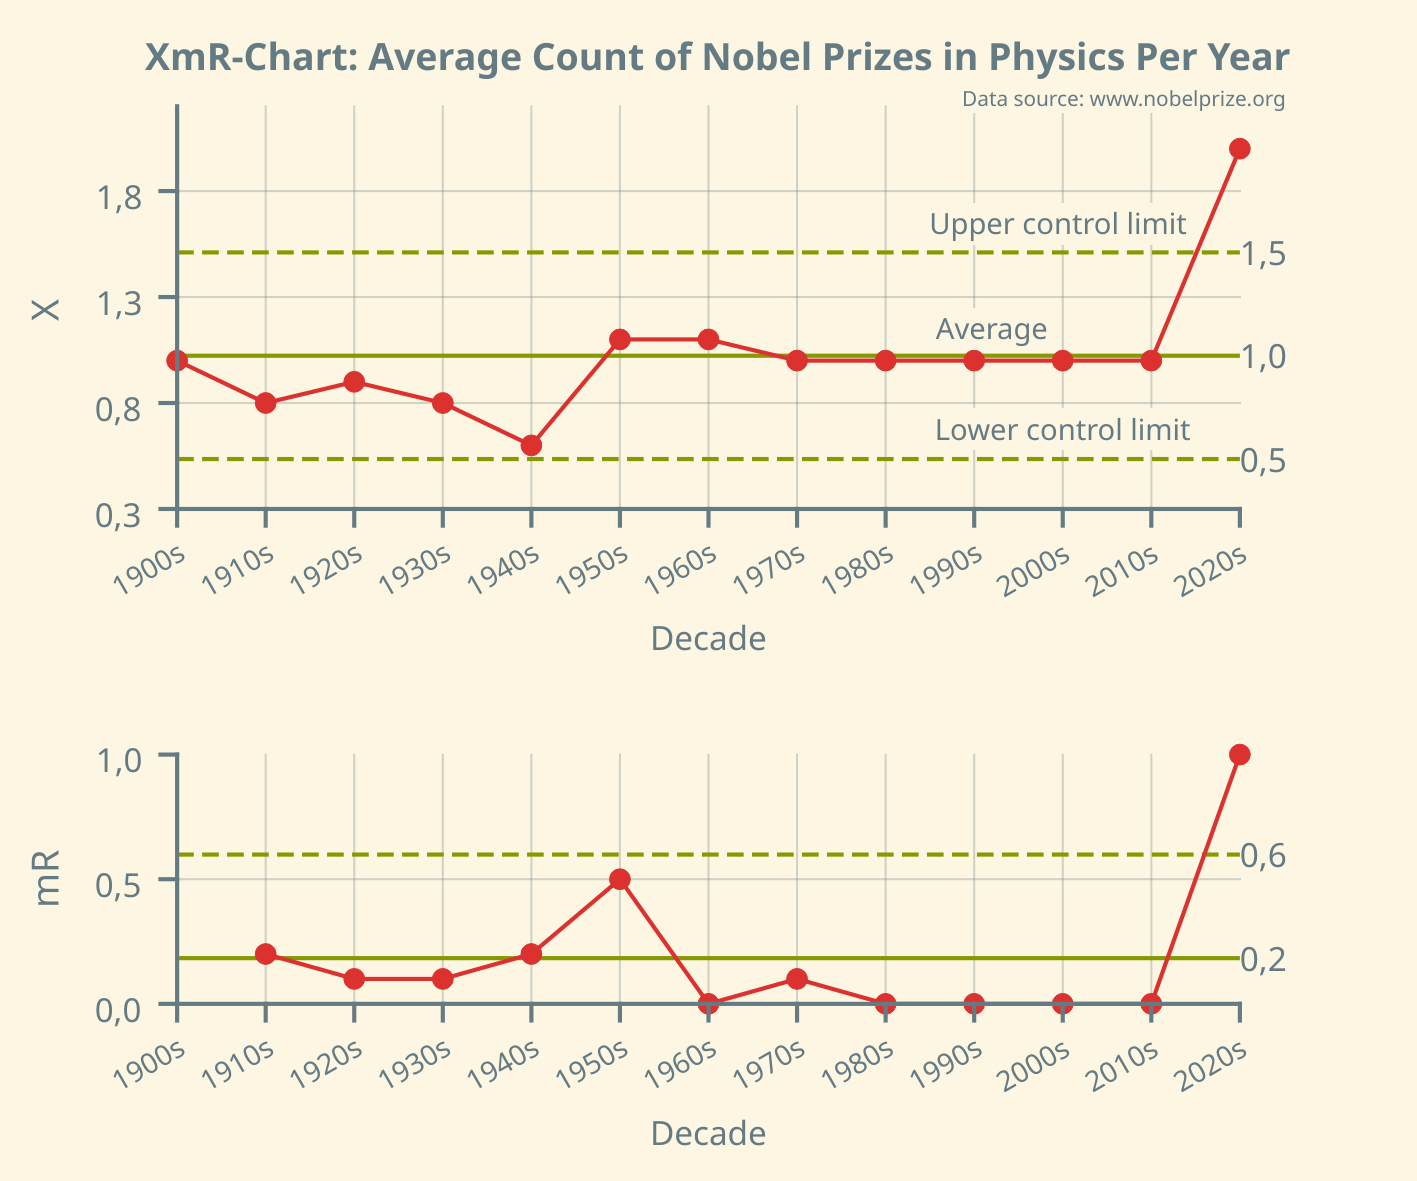
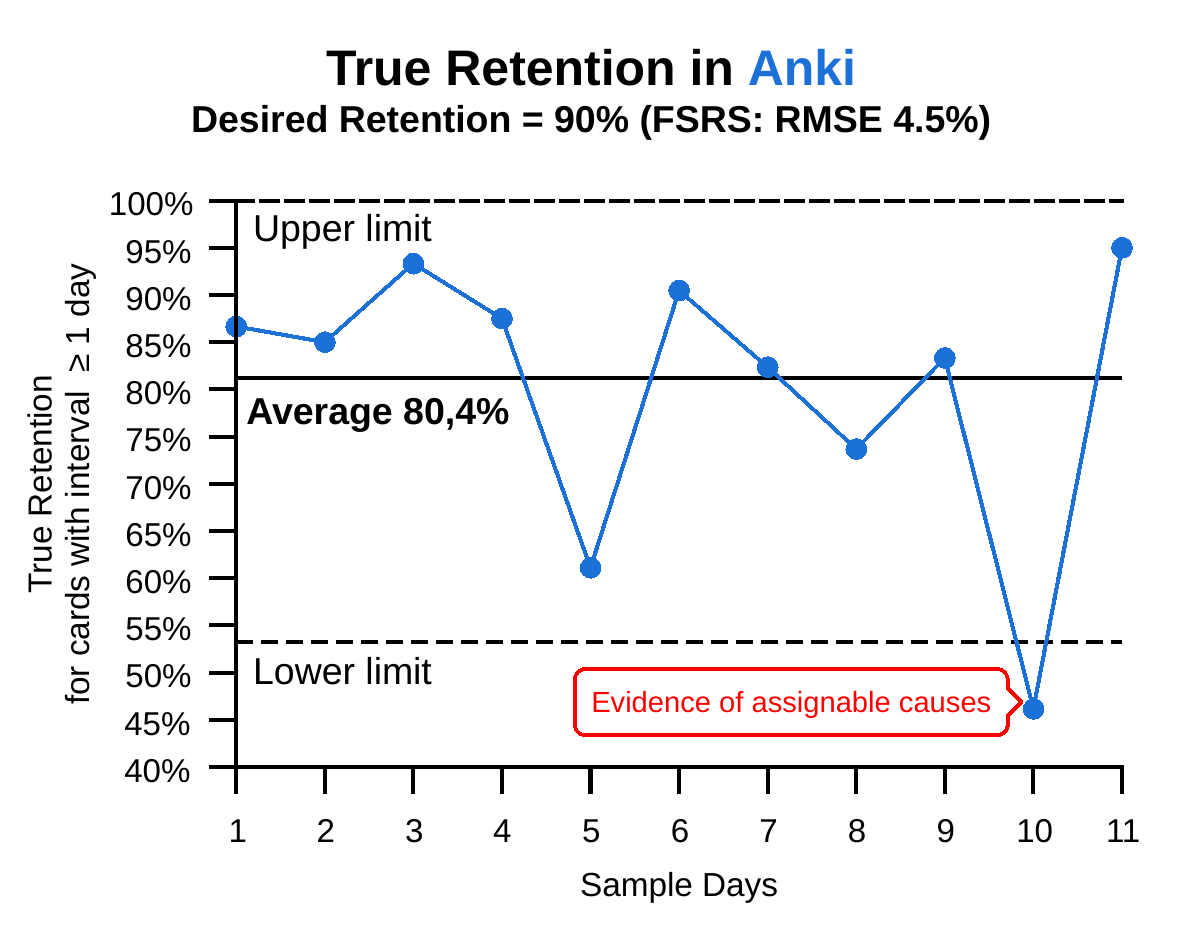
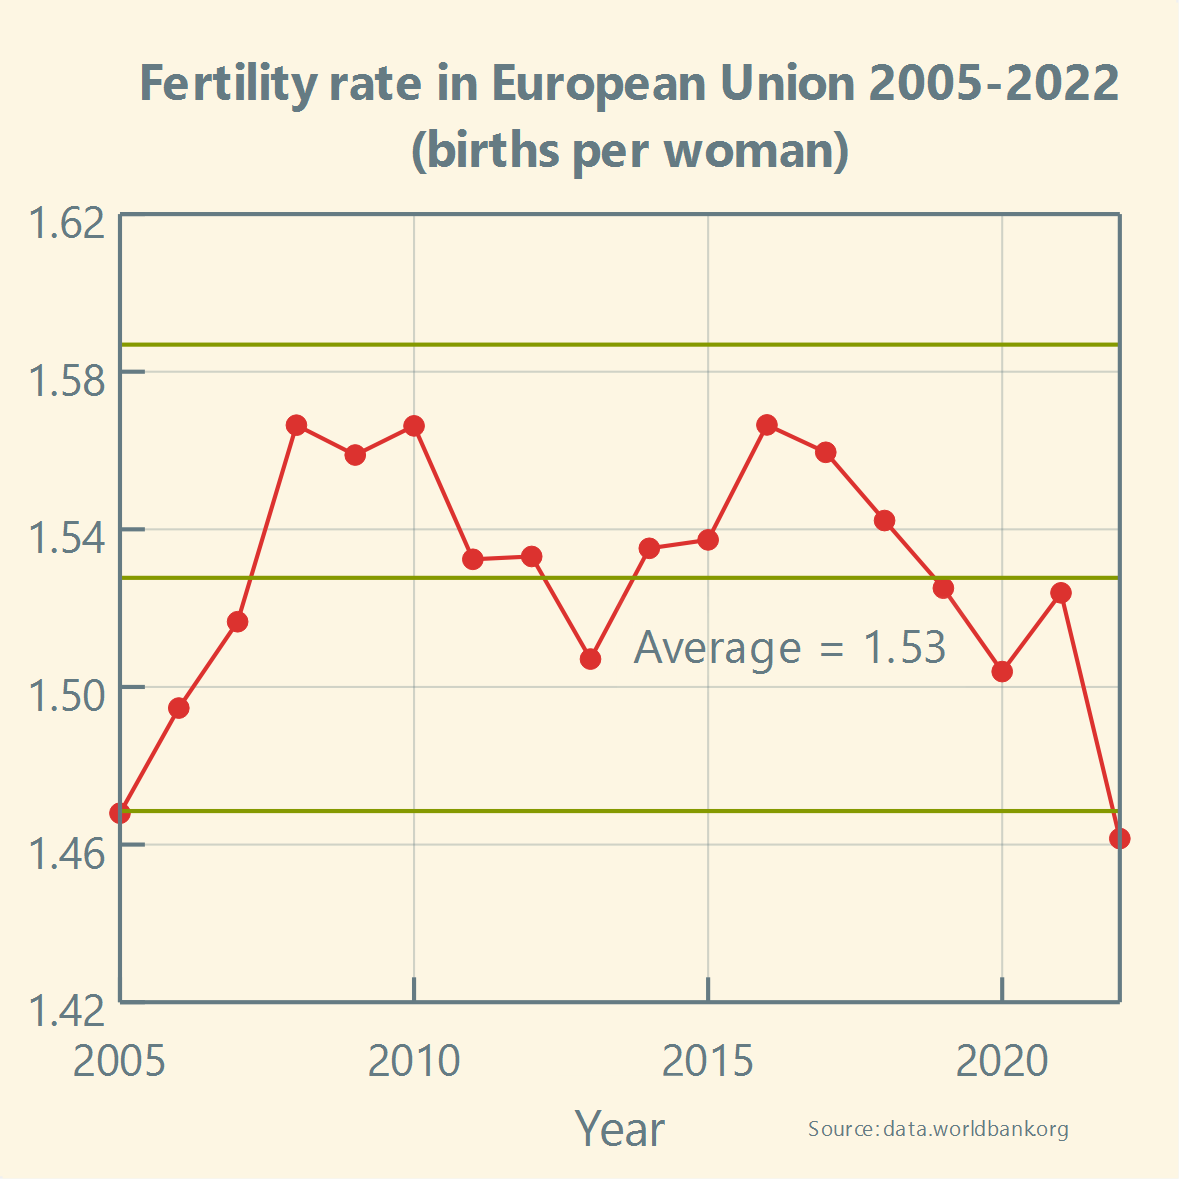
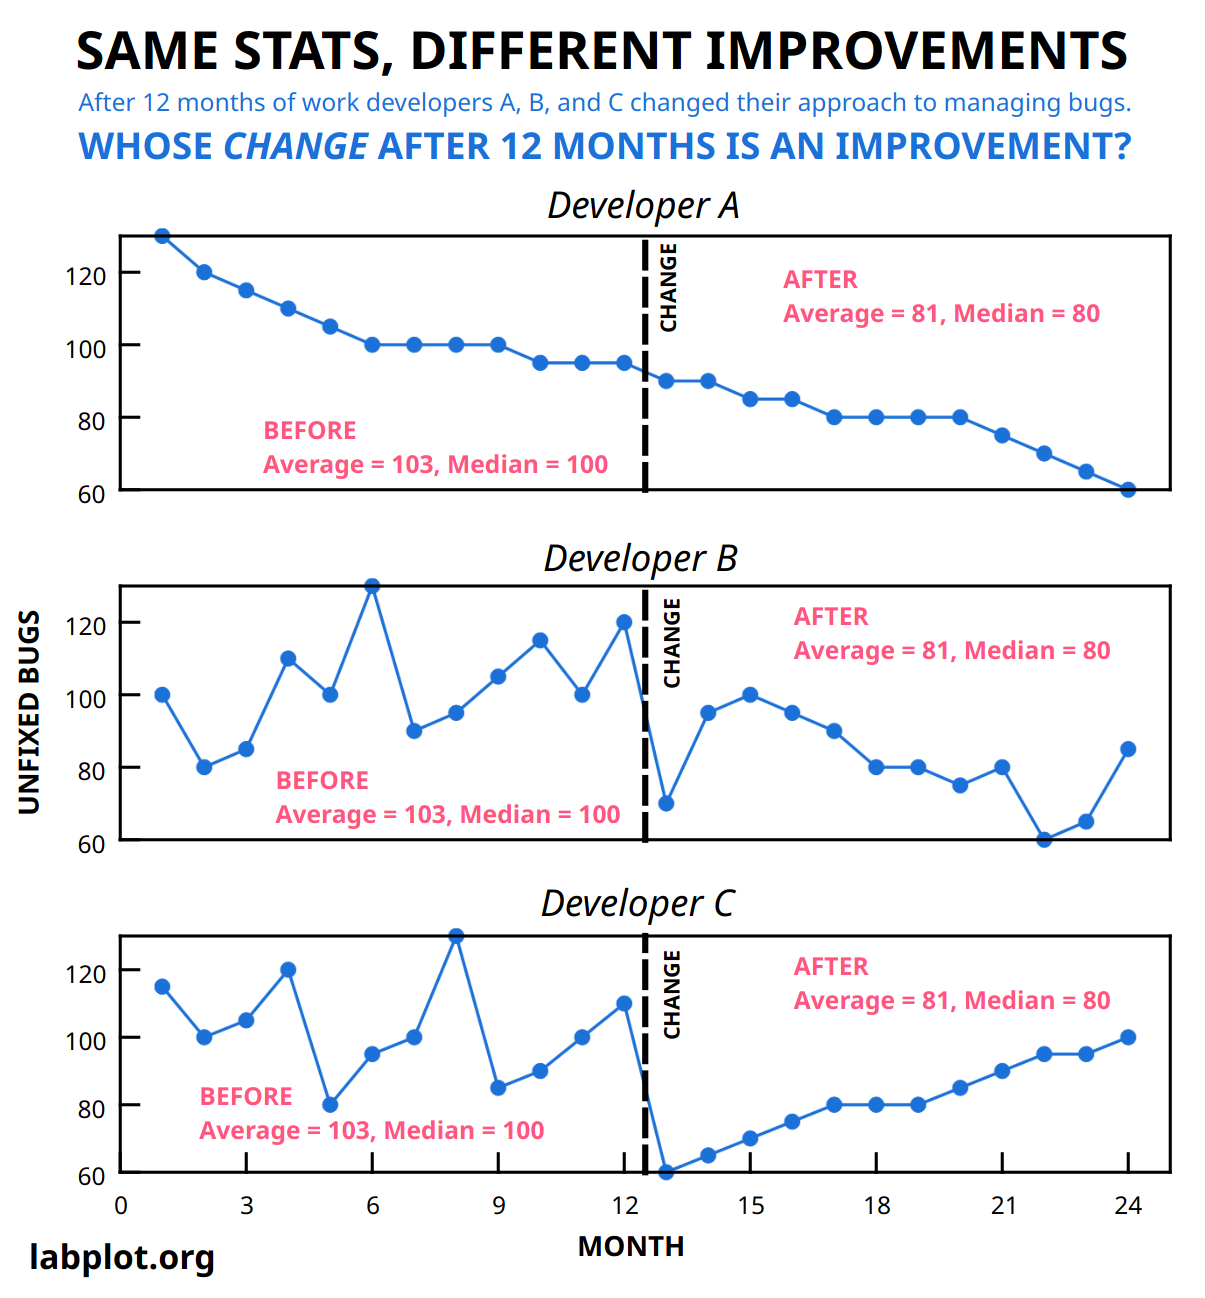
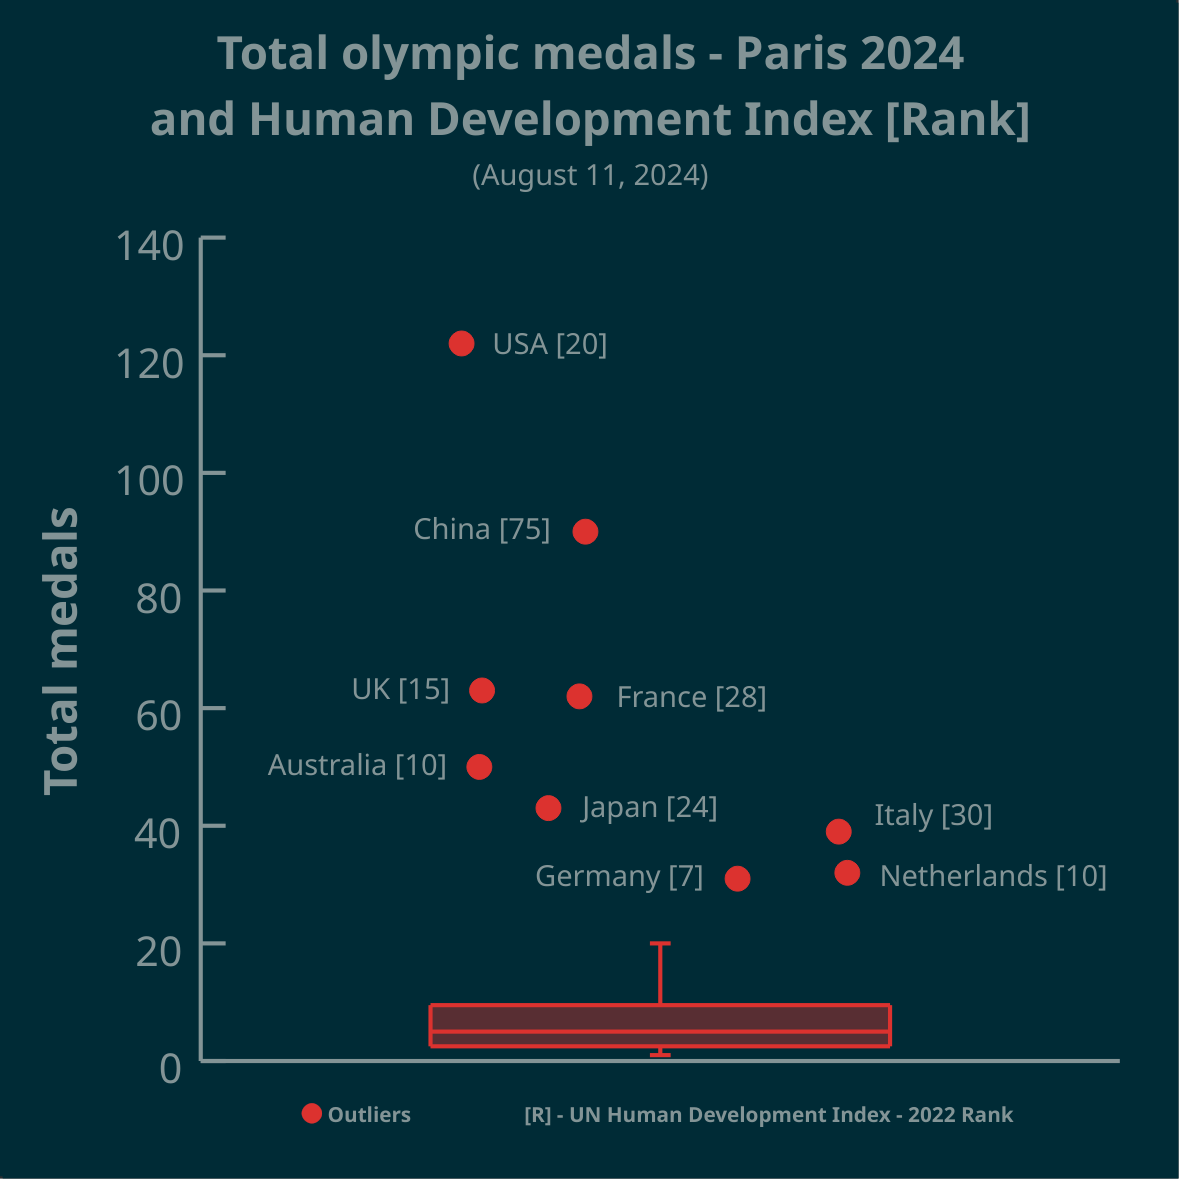
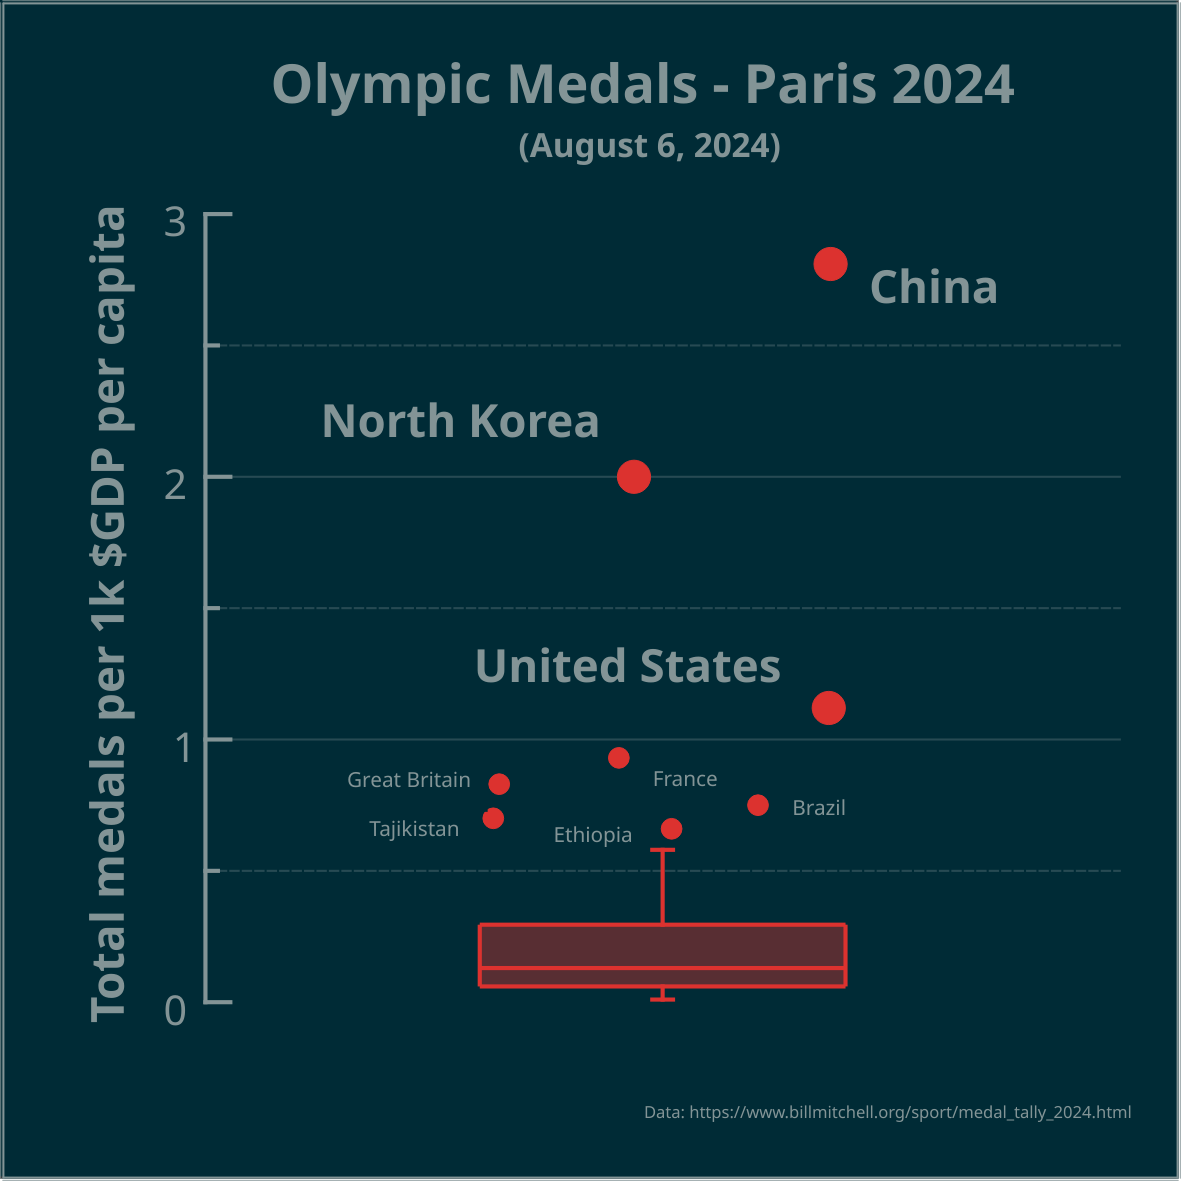
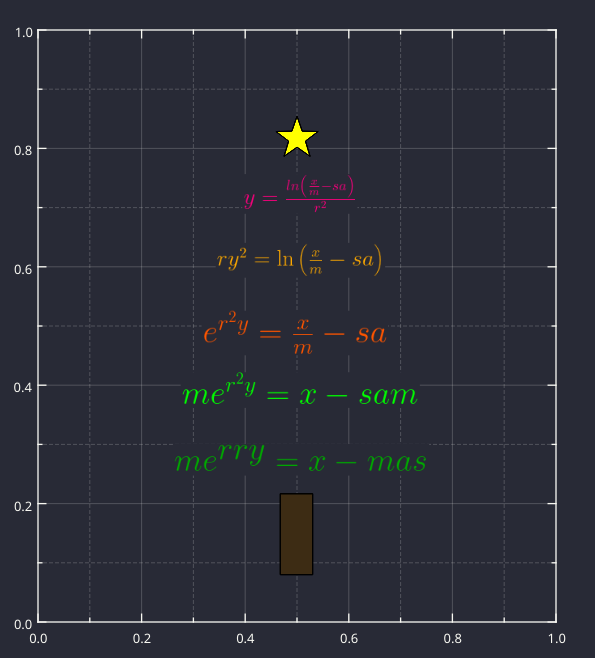
@blindbunny there is certainly an overlap in the functionality between LabPlot and MATLAB. Please check the list of features, the gallery and the demo videos on our homepage to see what LabPlot can do.